This thread is meant to list, describe and discuss current external sources that are picked up by the MEG. Ideally, these can later be identified and removed or mitigated, but in the meantime, they may be recognized, noted and possibly cleaned by SSP from noise recordings.
At this time, there are 3 distinct unusual artefacts seen in the MEG; with only one remaining to be identified:
A strong wide peak that gradually sweeps frequencies, eventually disappearing at the top of the MEG spectrum. This is from the MEG system itself when the electronics are warming up.
A weak well-defined oscillatory pulse every minute, jittered and following an irregular schedule. Unknown source.
A narrow peak around 0.7 Hz. This is from magnetic stirrers from labs on the floor above.
(4.) There is of course also a peak at 60 Hz and harmonics from the power lines.
Each artefact is described in more detail in separate posts below.
We finally determined this is an issue with the MEG electronics warming up. It only occurs “soon” after system startup, and lasts only a few minutes. So always start the MEG electronics and the acquisition software in “preview” mode, some time ahead of doing an initial recording, typically the empty room noise collection. Unfortunately, the delay for the system to warm up and the artefact to appear varies with the seasons (likely due to temperature and humidity changes), and can be over an hour in the summer.
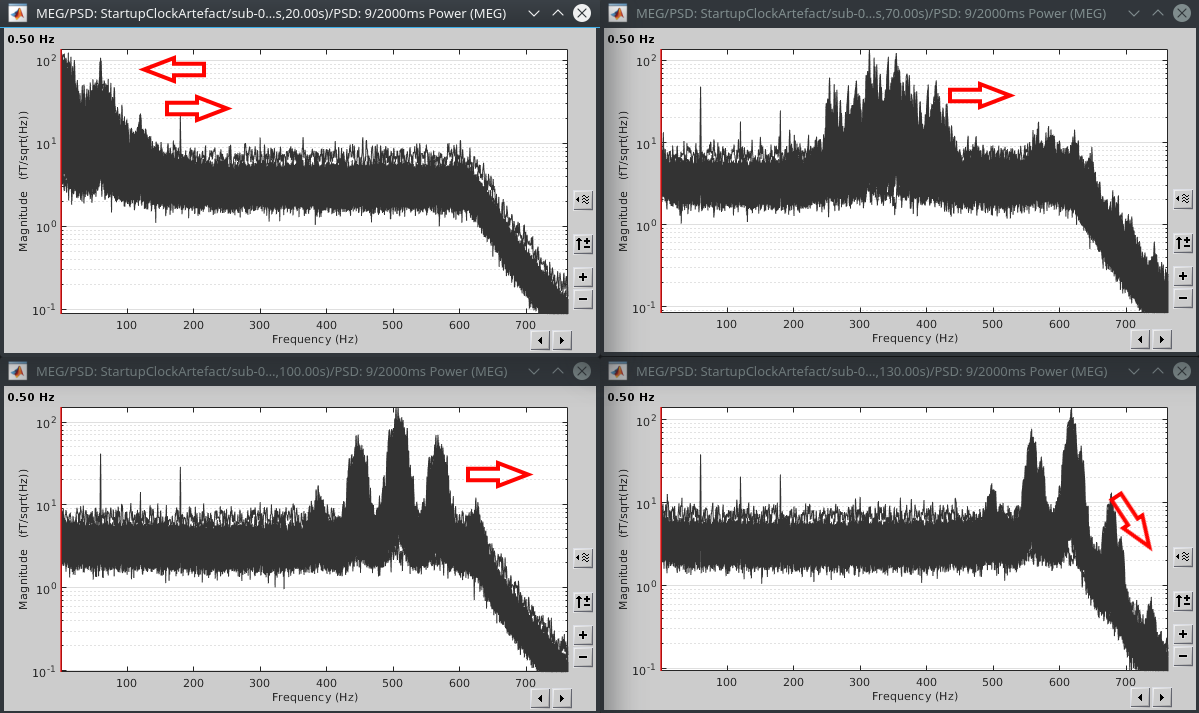
It has to do with the electronics clock being sensitive to temperature, and interacting with environmental noise, likely the 60 Hz power line noise. It’s very noticeable as increased high frequency noise in many channels. On the spectrum, it is a wide peak with side lobes, that slowly sweeps down, “bounces” at 0 Hz and then sweeps up until it disappears past our filter and sampling rate limits.
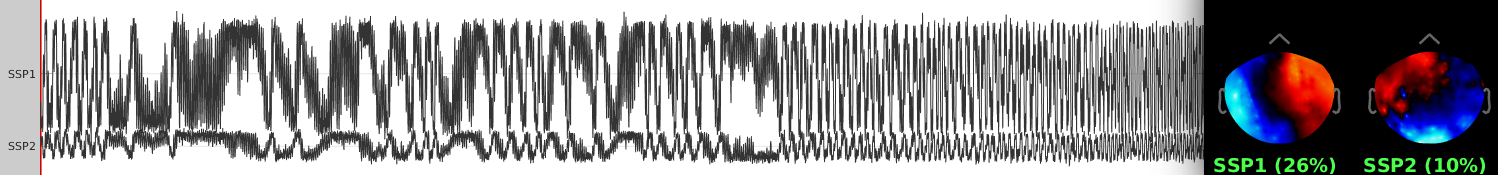
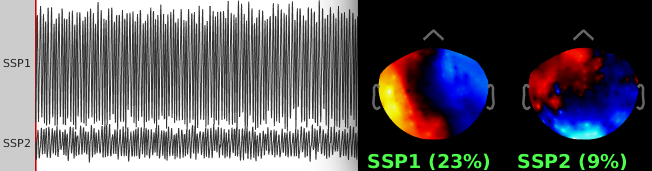
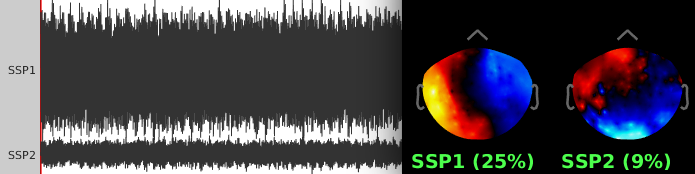
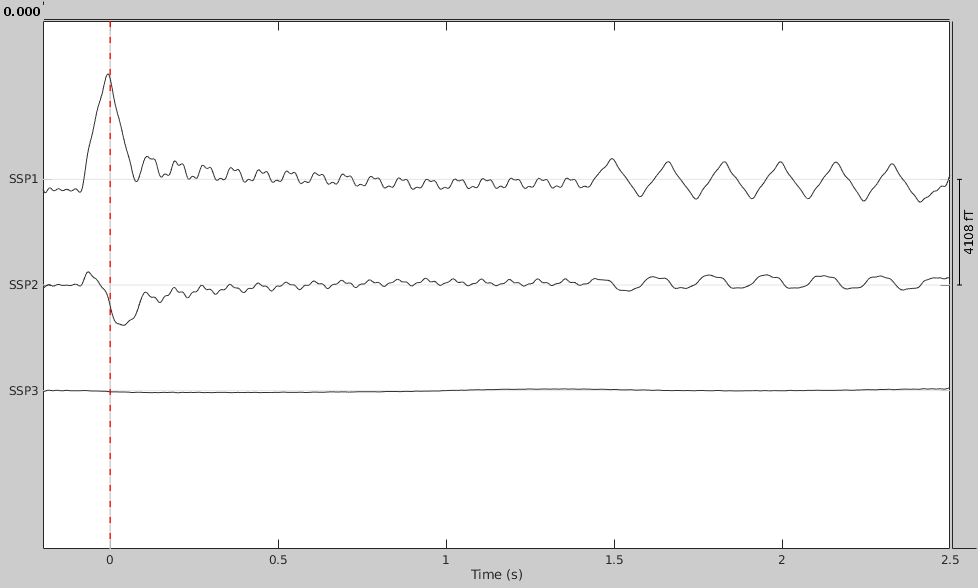
If this artefact is present in some data, it should clean fairly well with two SSP components. Thankfully, the sensor pattern doesn’t change as the artefact frequency evolves, so once the components are found by analyzing say 10 seconds of data focussing on the frequency range where the artefact is present, they can be used to clean the entire dataset, and even others. Here are the components obtained for the first three time windows displayed above, using appropriate frequency ranges for each:
This is a weak signal, barely visible during noise collections, so not much of a concern. It looks like an initial spike followed by about 1 second of 12 Hz oscillations and another second of 6 Hz oscillations.
It occurs not quite regularly, but approximately every minute. It is not always present: it seems to follow a variable schedule, mostly on during the day and off at night, though sometimes on around midnight. So it could be a device that automatically switches on based on occupancy sensors (hallway lights? possibly turning on for example when security does rounds at night).
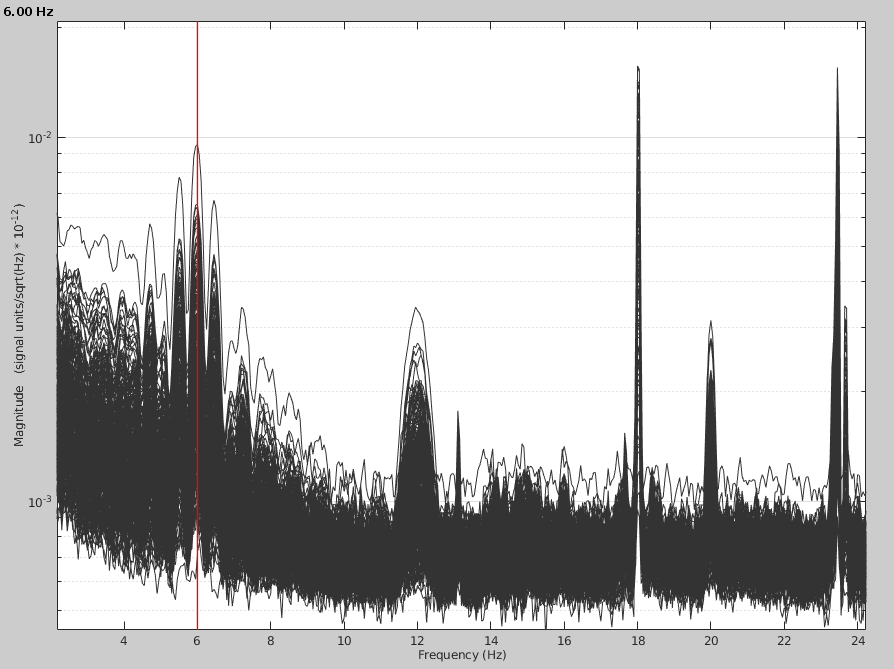
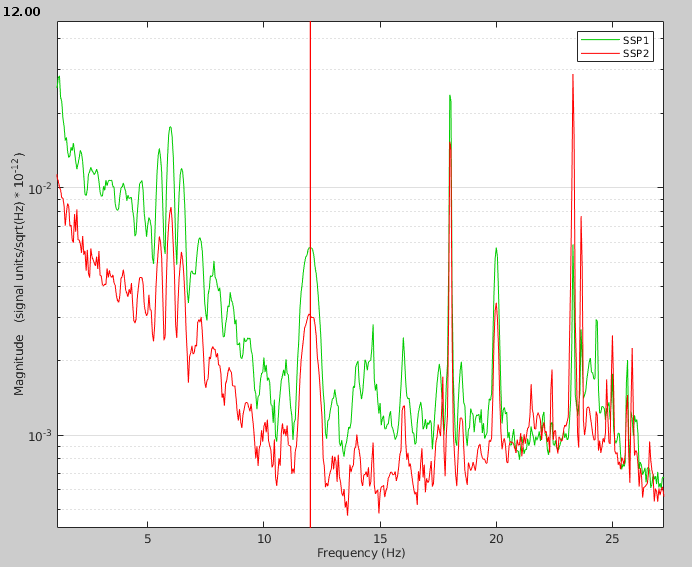
Here is the raw (no CTF noise reduction from reference channels) frequency spectrum showing peaks at 6 Hz and harmonics (12, 18 and 23.3 Hz?), among others. The side lobes around 6 Hz can be explained as due to the rectangular window that multiplies the signal (the oscillations only last a short time), and the harmonics since the signal looks more like a triangular than sine wave.
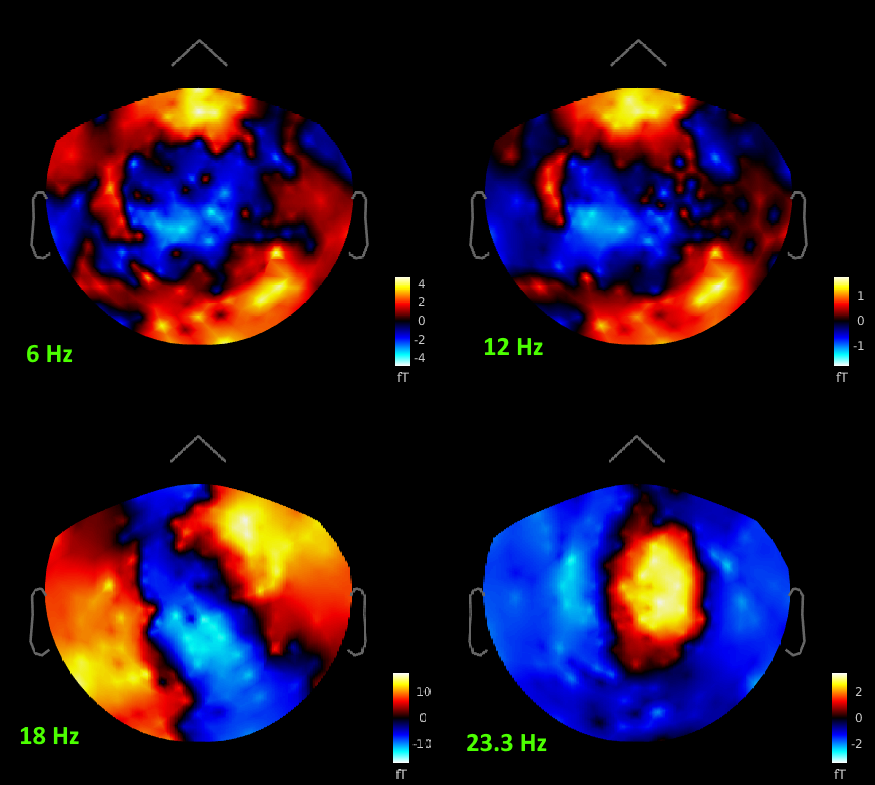
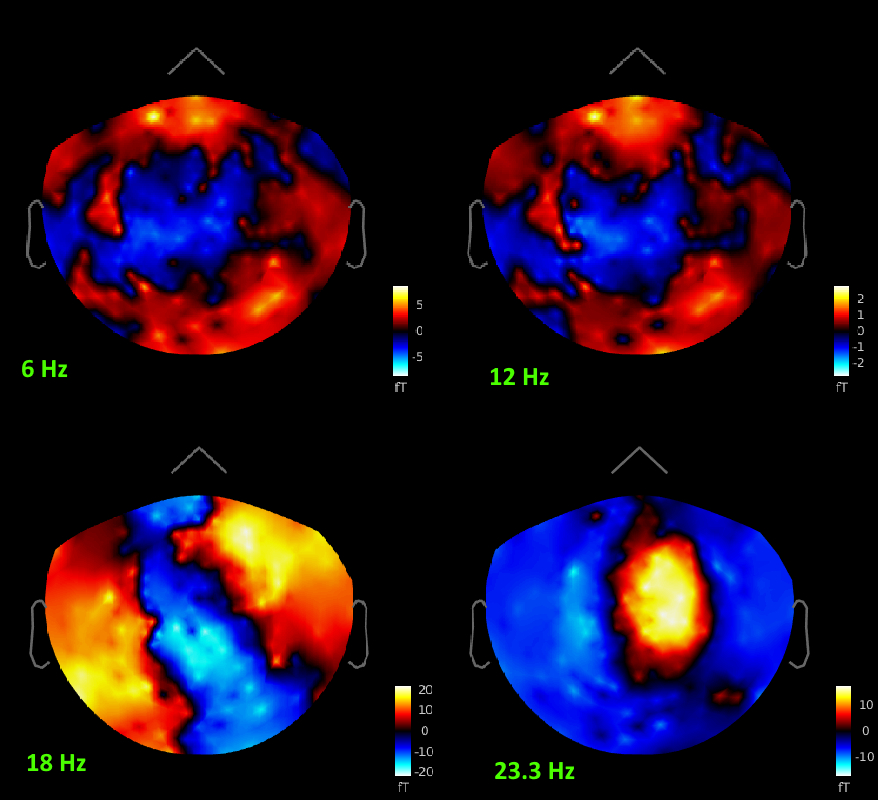
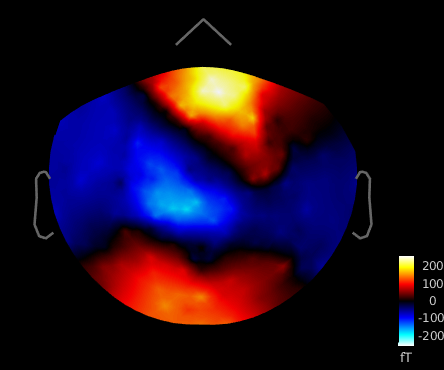
Here are the topographies of these 4 peaks from 2 different recordings on different days, obtained by fitting a single sinusoid (in phase) across channels.
If we do an SSP analysis, we can get two components that capture the whole of the artefact. The first component resembles the 6 and 12 Hz spatial patterns, while the second component resembles more the 23.3 Hz pattern and also seems 90 degrees out of phase with the first.
This artefact is confirmed to be coming from outside the shielded room and is not caused by something in the MEG lab that can be turned off during acquisition (computers and most other devices).
This was eventually found to be caused by magnetic stirrers (little magnets turning in beakers) from labs on the floor B1, above us. At some point (separate post below), they had added more stirrers in the room immediately above the MEG and the artefact was much worse. After investigating shielding options, they eventually agreed to remove the stirrers from that room.
Older observations and investigations:
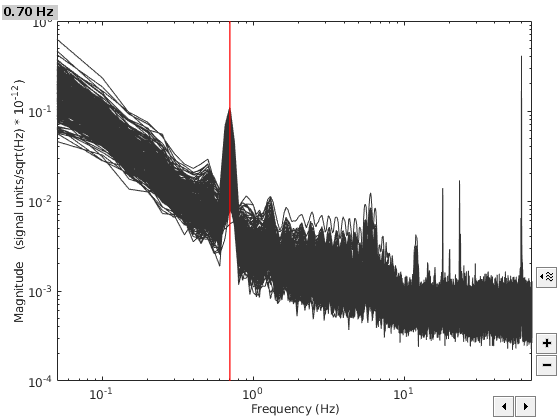
Almost always present since late 2020, even nights and weekends. This is a sharp peak with frequency almost always 0.7 Hz, though it has also been observed at 0.8 and 0.9 Hz. A similar peak was observed in some older noise recordings (before the system shutdown Mar to Aug 2020), but not the majority. The peak frequency and amplitude does not vary with the recording sampling rate (not aliased).
It’s confirmed to be coming from outside the shielded room (larger with door open) and is not due to anything that can be turned off while collecting (most devices and computers in the lab).
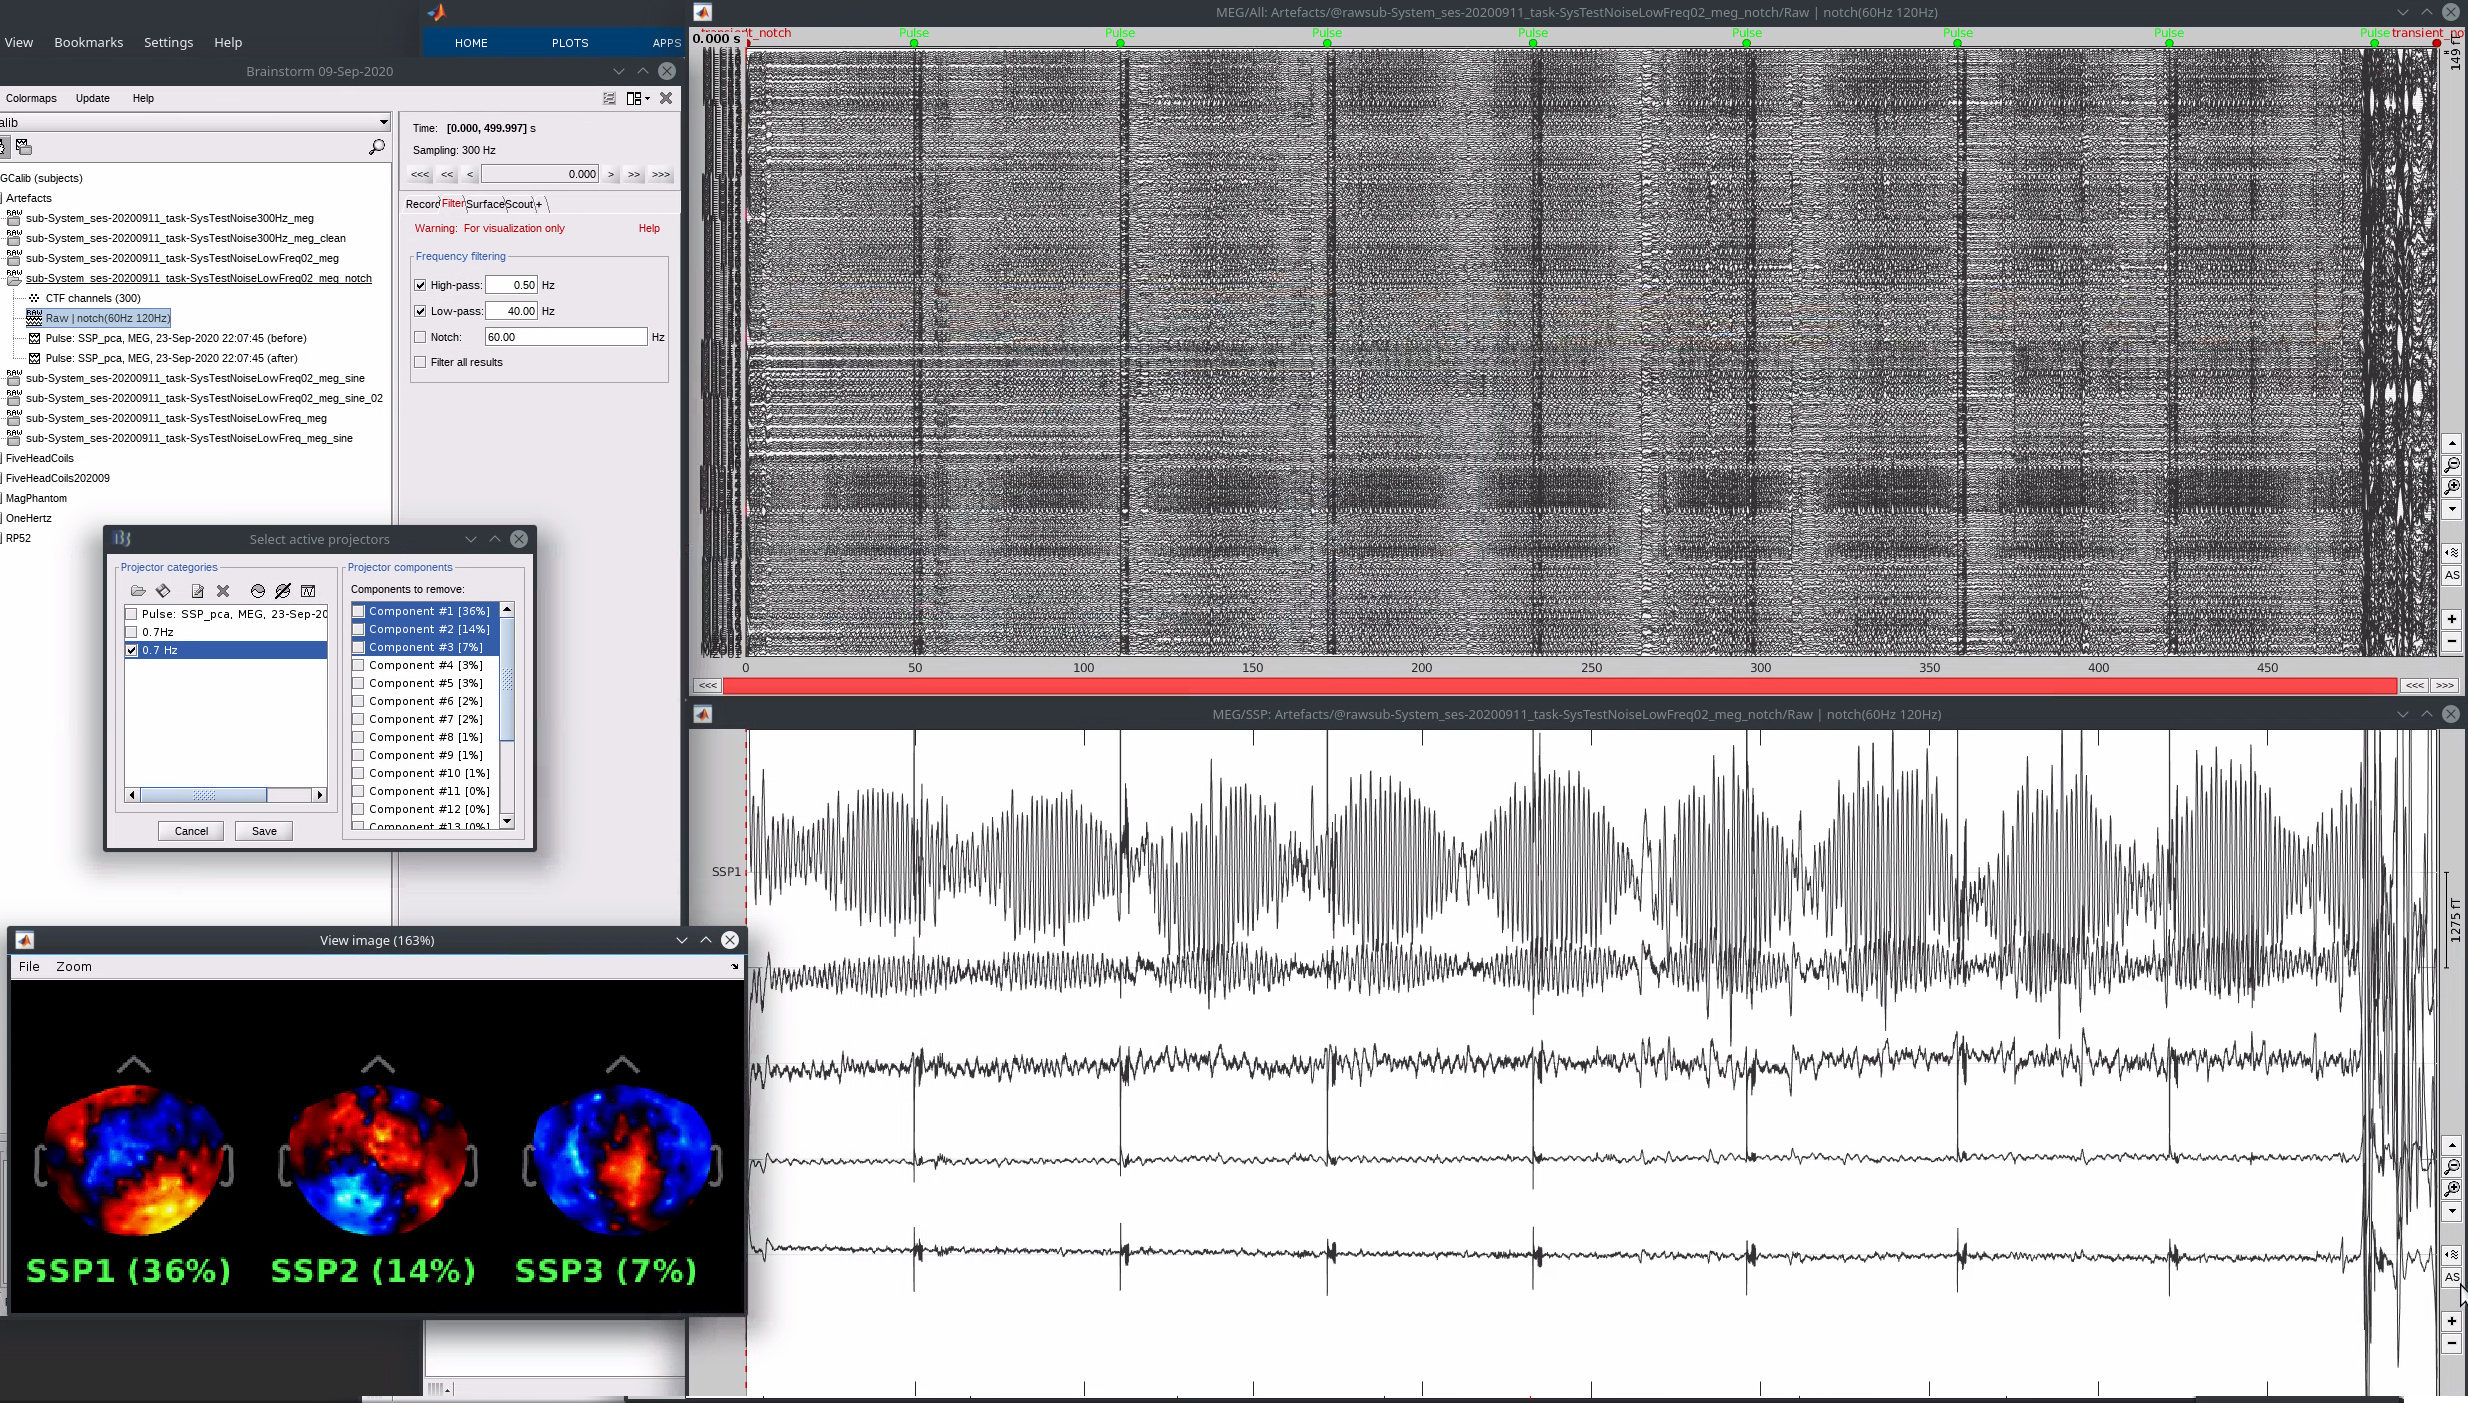
SSP analysis of empty room recording in Brainstorm, showing the topography of two components that seem to fully capture the artefact. The component time courses further show the constancy of the artefact and a pattern of beats lasting roughly 50 seconds, so a narrow frequency peak indeed.
This is an expected environmental signal which is not fully attenuated by the shielding. Here is the topography of a sinusoid fit at 60 Hz to the raw empty room data, for comparison with other artefacts. None of the above match this topography exactly.
3. (continued) Stronger 0.7 Hz & harmonics up to 10 Hz
This is no longer the case. The magnetic stirrers were removed from the room right above the MEG lab.
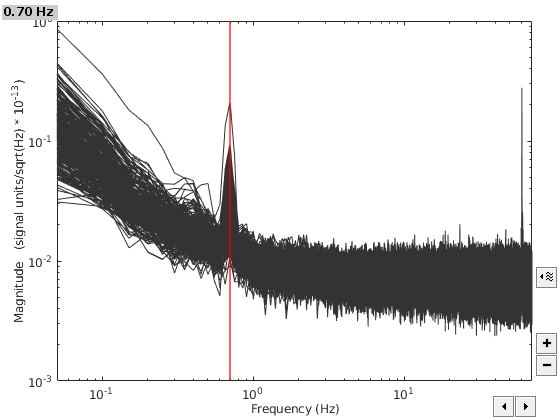
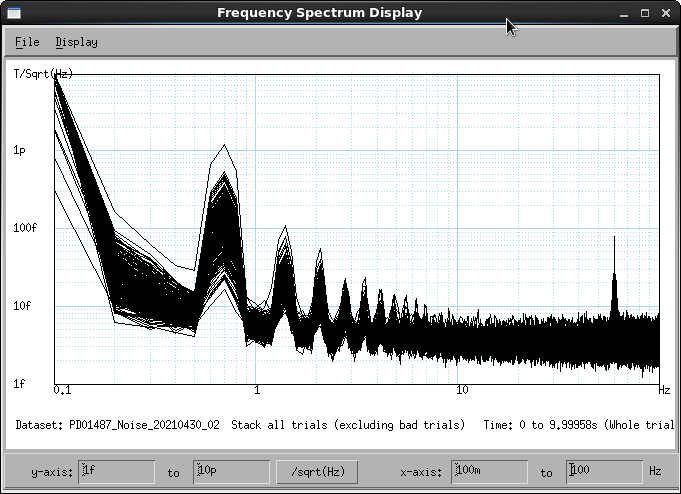
Unfortunately, this previously reported artefact is now much worse. The amplitude is much larger, causing harmonics to also rise above the noise floor. This also interacts with the power line noise producing side peaks around 60 Hz. This is what a standard noise recording now looks like:
I’m hoping that this can be cleaned with SSP as we did previously for a sensor issue. I will confirm later, but it would surely require at least 2 components since the phase of the signal varies across sensors, thus it is not a fixed topography. I will update this post once I figure this out. Note that this phase variation also causes the shape to deviate from a sine wave with the application of 3rd gradient noise suppression (aka CTF compensation in Brainstorm), while the raw signals are very sine-like.
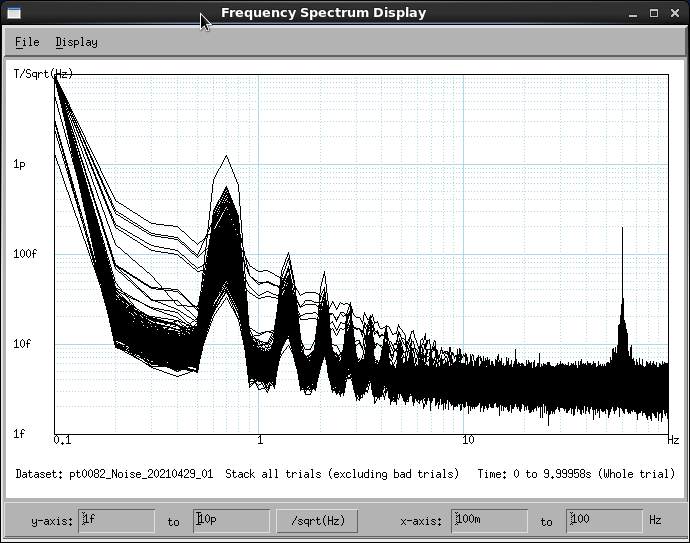
Finally, please pay attention to the noise spectrum as this artefact can make it more difficult to see other issues. Recently, MRT27, which is disabled, regularly needs to be defluxed when it causes jumps in neighboring channels. This is what the spectrum looks like in such an example: